* Autor de contacto:
ralvarez@agro.uba.ar
Recibido:
04-09-23
Recibido con revisiones: 25-10-23
Aceptado:
27-10-23
FERTILIZATION INCREASES SOIL ORGANIC CARBON STOCKS BUT DOES NOT
MITIGATE CLIMATE CHANGE IN THE ARGENTINE PAMPAS
Roberto Alvarez 1 *
1 Cátedra de Fertilidad y Fertilizantes, Facultad de Agronomía, Universidad de Buenos Aires, Argentina
ABSTRACT
Soils can act as carbon sinks mitigating global warming. This generates interest in determining how agricultural practices affect the stock of soil organic carbon (SOC). Fertilization increases SOC stocks and its impacts have been calculated at a global level. The aim of this study was to determine if fertilization leads to carbon sequestration in the Pampas of Argentina. A meta-analysis of local studies was performed to determine how fertilization impacts SOC stocks in agricultural soils. Forty studies were compiled presenting data from 27 experiments from which 109 comparisons of SOC stocks between fertilized and unfertilized treatments were extracted. Fertilization caused a significant increase of ca. 3% in the topsoil (0-20 cm) SOC stock. When nutrients application rate could be accurately defined (n= 71), the average increase in SOC stock was ca. 1 t ha-1. Increments were much smaller in comparison with those reported in literature and the carbon footprint of applied nutrients (2.31 t Ceq. ha-1). Even if increments in SOC stock in the subsoil were similar to those measured in the topsoil, greenhouse gas emission from fertilizer application would not be offset by the carbon sequestered in the soil. Fertilization has a low impact on SOC stocks and does not compensate greenhouse gases emissions in the Pampas. Rates of SOC increments resulting from fertilization identified in other regions of the world should not be applied in this region.
Keywords: carbon sequestration, life cycle assessment, management practices.
LA FERTILIZACIÓN AUMENTA EL CARBONO ORGÁNICO DEL SUELO EN
LA PAMPA ARGENTINA PERO NO MITIGA EL CAMBIO CLIMÁTICO
RESUMEN
Los suelos pueden actuar como sumideros de carbono y mitigar el calentamiento global. Esto genera interés en determinar cómo las prácticas agrícolas afectan las reservas de carbono orgánico del suelo (COS). La fertilización produce aumentos en el COS y se han calculado coeficientes de su impacto a nivel global. El objetivo fue determinar si la práctica de la fertilización conduce al secuestro de carbono en la Región Pampena de Argentina. Se realizó un metanálisis de estudios locales para determinar cómo la fertilización afecta el COS en los suelos agrícolas. Se compilaron cuarenta estudios que presentaban datos de 27 experimentos de los cuales se extrajeron 109 comparaciones de existencias de COS entre tratamientos fertilizados y no fertilizados. La fertilización determinó un aumento significativo de ca. 3% en la reserva de COS de la capa superior del suelo (0-20 cm). En los casos en los que la dosis de nutrientes aplicados estuvo bien definida (n= 71), el aumento promedio en el COS fue de ca. 1 t ha-1. Este aumento fue mucho menor que los aumentos de COS informados en la literatura y que la huella de carbono de los nutrientes aplicados (2,31 t Ceq. ha-1). Incluso suponiendo que el aumento relativo del COS en el subsuelo fuera similar al medido en la capa superficial, las emisiones de gases de efecto invernadero procedentes de la aplicación de fertilizantes no serían compensadas por el carbono secuestrado en el suelo. La fertilización es una práctica que tiene bajo impacto en el COS y no mitiga el calentamiento global en la Región Pampeana. En esta región no se deben aplicar los coeficientes de aumento de carbono por fertilización determinados en otras regiones del mundo.
Palabras clave: secuestro de carbono, análisis de ciclo de vida, prácticas de manejo.
INTRODUCTION
It is possible to transform cultivated soils into atmospheric carbon sinks as a mechanism to mitigate global warming (Paustian et al., 2016; Lal, 2017). With adequate management practices, around 20-35% of human carbon emissions could be sequestered in these soils (Minasny et al., 2017). Fertilization is among the management practices that allow increasing soil organic carbon (SOC) stock. Several global meta-analyses have shown that the application of nutrients to the soil promotes an increase in SOC stocks compared to unfertilized controls (Geisseler & Scow, 2014; Han et al., 2016; Ladha et al., 2011). The increase of the SOC stocks is produced by higher residue carbon input (Lu et al., 2011; Tian et al., 2015) and a decrease in microbial respiration (Ramirez et al., 2012; Xu et al., 2020) which leads to a longer residence time of the SOC (Lu et al., 2011). The increase of SOC content is produced only in agroecosystems with residue returned (Alvarez, 2005). A regional survey in China’s croplands showed that SOC stock increased between 1980 and 2011 (Tao et al., 2019), in line with existing meta-analyses. Such increase of the SOC stock was partially attributed to a greater productivity of fertilized crops.
Unfortunately, not every increase in SOC stock implies that the greenhouse effect is mitigated. Life cycle studies show that the increases in SOC content due to improved management practices may not compensate for the effect of additional emission of greenhouse gases associated to the implementation of such practices (Schlesinger & Amundson, 2018). It is important that soils do not act as a source of CO2 and become carbon sinks (Sykes et al, 2020), not only because the carbon cycle will be impacted but also soil productivity (Soussana et al., 2019) and quality (Fazeria, 2012; Feller et al., 2012) will be improved. Consequently, to determine the effect of fertilization on global warming, its impact on SOC stock must be determined along with the associated greenhouse gas emissions.
The Pampas Region in Argentina is an area of great importance due to its capacity to produce grain crops (Dominguez & Rubio, 2019). Fertilization is a massively adopted practice but its effects on SOC stocks and greenhouse gas emissions are unknown. The objectives of this study are to evaluate the impact of fertilization on SOC levels in Pampean soils and to contrast the carbon sequestered in soils with the additional greenhouse emissions due to the implementation of such practice. This study seeks to assess whether the application of fertilizers can be considered a way to mitigate the greenhouse effect or a management practice that enhances global warming.
MATERIALS AND METHODS
Study area
The Pampas is a plain area of ca. 50 Mha, located between 28ºS-40ºS and 57ºW-66 ºW in Argentina (Figure 1). Natural vegetation consists of grassland and around 33 Mha are under cultivation (INDEC, 2022). The mean annual temperature varies from 14ºC to 23ºC from South to North and mean annual rainfall increases from 500 mm to 1200 mm from West to East. Mollisols are the predominant soils with both texture and SOC content following the rainfall gradient: coarse soils with low SOC content in the West to fine soils with high SOC content in the East (Berhongaray et al., 2013). Well-drained soils are cultivated with grain crops while hydromorphic areas have remanent grasslands used for grazing. Main crops are soybean (Glycine max L.) Merr.), wheat (Triticum aestivum L.), corn (Zea mays L.) and sunflower (Helianthus annuus L.) (MINAGRI, 2022). Alfalfa (Medicago sativa L.) based pastures are rotated with grain crops in some areas. Approximately 90% of the cultivated surface is managed with no-tillage (Noceli Pac, 2018) and crop residues are left in the field.
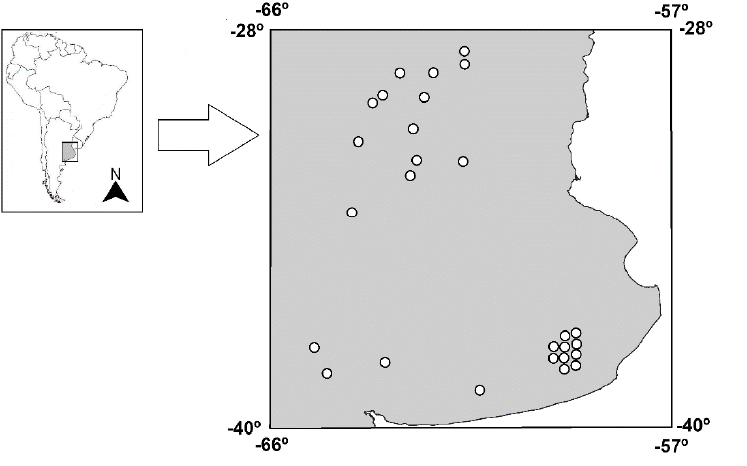
Figure 1: Map of the Pampas Region showing the location of experimental sites. Some points have been slightly shifted from their actual location to avoid overlapping.
Figura 1: Mapa de la Región Pampeana mostrando la ubicación de los sitios experimentales. Algunos puntos han sido levemente corridos de su ubicación real para evitar superposiciones.
Data search and processing
A bibliographic search was carried out between June 5 and June 10 of 2022 to identify articles where the impact of fertilizer application on SOC was evaluated in the Pampas region. The search period was set from 1980 to June 2022. Both the Google Scholar and Scopus databases were used to locate articles published in international scientific journals. The search terms were “Argentina” AND “fertilization” or “Argentina” AND “soil carbon”. In addition, an online local journal on soil science (Ciencia del Suelo) was fully reviewed. Proceedings of the Argentina’s National Soil Science Congress in which full length papers were published were reviewed (11 proceedings since year 2000) as well. An online search of technical bulletins of INTA, a governmental institution dedicated to technological improvement in the agricultural sector, was also performed. As a result of this search, 40 articles were identified in which SOC levels were investigated under different fertilization regimes. The published data corresponded to 27 field experiments distributed in the Pampas under a very wide range of soil and climate conditions (Table 1, Figure 1). To be included in this study an experiment had to meet the following conditions: 1) it should be a field experiment, 2) it should include a non-fertilized control compared with one or more fertilized treatments, 3) the SOC stock or concentration should be reported for all treatments, 4) the sampling depth should be specified, 5) the nutrient combinations of fertilizers should be defined, 6) the duration of the experiments should be indicated and 7) the experimental design should be clear and the number of replications mentioned.
Table 1: Main characteristics of the experiments used in the meta-analysis.
Tabla 1: Principales características de los experimentos incluidos en el meta-análisis.
|
Reference |
Experiment |
Location |
Soil Type |
Sampling depth |
Years |
Replications |
Rotation |
Sand |
Rainfall |
Treatments |
N rate |
P rate |
S rate |
|||||||
|
(cm) |
(%) |
(mm) |
(kg ha-1 yr-1) |
(kg ha-1 yr-1) |
(kg ha-1 yr-1) |
|||||||||||||||
|
Ciampiti et al. 2011 |
1 |
Canals |
Entic |
0-20 |
6 |
3 |
C-W/S |
35.4 |
920 |
NPS |
Undefined |
34 |
Undefined |
|||||||
|
García et al. 2010 |
||||||||||||||||||||
|
Vega Jara et al. 2020 |
2 |
Teodelina |
Typic |
0-20 |
13 |
3 |
C-W/S |
35.1 |
1110 |
PS |
0 |
37 |
21 |
|||||||
|
García et al. 2010 |
NS |
Undefined |
0 |
21 |
||||||||||||||||
|
Ciampiti et al. 2011 |
NP |
Undefined |
37 |
0 |
||||||||||||||||
|
Verdenelli et al. 2018 |
NPS |
Undefined |
37 |
21 |
||||||||||||||||
|
NPS+M |
Undefined |
37 |
21 |
|||||||||||||||||
|
Vega Jara et al. 2020 |
3 |
Santa Isabel |
Typic |
0-20 |
13 |
2 |
C-W/S |
20 |
967 |
PS |
0 |
37 |
21 |
|||||||
|
García et al. 2010 |
NS |
Undefined |
0 |
21 |
||||||||||||||||
|
Ciampiti et al. 2011 |
NP |
Undefined |
37 |
0 |
||||||||||||||||
|
NPS |
Undefined |
37 |
21 |
|||||||||||||||||
|
NPS+M |
Undefined |
37 |
21 |
|||||||||||||||||
|
Vega Jara et al. 2020 |
4 |
Gral. |
Typic |
0-20 |
13 |
3 |
C-S-W/S |
28.1 |
920 |
PS |
0 |
37 |
21 |
|||||||
|
García et al. 2010 |
NS |
Undefined |
0 |
21 |
||||||||||||||||
|
Ciampiti et al. 2011 |
NP |
Undefined |
37 |
0 |
||||||||||||||||
|
NPS |
Undefined |
37 |
21 |
|||||||||||||||||
|
NPS+M |
Undefined |
37 |
21 |
|||||||||||||||||
|
Vega Jara et al. 2020 |
5 |
Amstrong |
Aquic |
0-20 |
13 |
3 |
C-S-W/S |
31 |
1047 |
PS |
0 |
37 |
21 |
|||||||
|
García et al. 2010 |
NS |
Undefined |
0 |
21 |
||||||||||||||||
|
Ciampiti et al. 2011 |
NP |
Undefined |
37 |
0 |
||||||||||||||||
|
NPS |
Undefined |
37 |
21 |
|||||||||||||||||
|
NPS+M |
Undefined |
37 |
21 |
|||||||||||||||||
|
Vega Jara et al. 2020 |
6 |
San Jorge |
Typic |
0-20 |
13 |
3 |
C-S-W/S |
30 |
1047 |
PS |
0 |
37 |
21 |
|||||||
|
García et al. 2010 |
NS |
Undefined |
0 |
21 |
||||||||||||||||
|
Ciampiti et al. 2011 |
NP |
Undefined |
37 |
0 |
||||||||||||||||
|
NPS |
Undefined |
37 |
21 |
|||||||||||||||||
|
NPS+M |
Undefined |
37 |
21 |
|||||||||||||||||
|
Martinez et al. 2019 |
7 |
Arequito |
Typic |
0-20 |
4 |
3 |
S-S |
4.4 |
1003 |
PS |
0 |
24 |
26 |
|||||||
|
Martinez et al. 2014a |
S-CC |
NPS |
34 |
24 |
26 |
|||||||||||||||
|
Martinez et al. 2014b |
, |
|||||||||||||||||||
|
Crespo et al 2021a |
8 |
Balcarce |
Typic |
0-20 |
10 |
3 |
S-S |
42.9 |
887 |
PS |
Undefined |
Undefined |
Undefined |
|||||||
|
Crespo et al 2021b |
S-CC |
NPS |
Undefined |
Undefined |
Undefined |
|||||||||||||||
|
Beltrán et al. 2018 |
||||||||||||||||||||
|
Martinez et al. 2019 |
||||||||||||||||||||
|
Martinez et al. 2014a |
||||||||||||||||||||
|
Martinez et al. 2014b |
||||||||||||||||||||
|
Crespo et al 2021a |
9 |
Marcoz |
Typic |
0-20 |
10 |
3 |
S-S |
13.3 |
925 |
PS |
Undefined |
Undefined |
Undefined |
|||||||
|
Crespo et al 2021b |
S-CC |
NPS |
Undefined |
Undefined |
Undefined |
|||||||||||||||
|
Crespo et al 2021a |
10 |
Paraná |
Aquic |
0-20 |
10 |
3 |
S-S |
17.8 |
1060 |
PS |
Undefined |
Undefined |
Undefined |
|||||||
|
Crespo et al 2021b |
S-CC |
NPS |
Undefined |
Undefined |
Undefined |
|||||||||||||||
|
Crespo et al 2021a |
11 |
General Villegas |
Typic |
0-20 |
10 |
3 |
S-S |
65 |
909 |
PS |
Undefined |
Undefined |
Undefined |
|||||||
|
Crespo et al 2021b |
S-CC |
NPS |
Undefined |
Undefined |
Undefined |
|||||||||||||||
|
Melchiori et al. 2014 |
12 |
Paraná |
Aquic |
0-10 |
18 |
3 |
C-C |
4.5 |
1060 |
N |
69 |
0 |
0 |
|||||||
|
N |
138 |
0 |
0 |
|||||||||||||||||
|
N |
276 |
0 |
0 |
|||||||||||||||||
|
Manso, Forjan, 2014 |
13 |
Barrow |
Petrocalcic Paleudoll |
0-15 |
10 |
6 |
C-S-W-Su-W-C-S-B/S-W-Su |
7.7 |
911 |
N |
Undefined |
0 |
0 |
|||||||
|
Vivas et al. 2012 |
14 |
Bernardo de Irigoyen |
Typic |
0-20 |
11 |
4 |
W/S-C-S |
1.9 |
1047 |
P |
0 |
20 |
0 |
|||||||
|
P |
0 |
40 |
0 |
|||||||||||||||||
|
S |
0 |
0 |
12 |
|||||||||||||||||
|
S |
0 |
0 |
24 |
|||||||||||||||||
|
S |
0 |
0 |
36 |
|||||||||||||||||
|
Irizar et al. 2006 |
15 |
Pergamino |
Typic |
25001 |
25 |
2 |
W/S-C |
12.5 |
1034 |
N |
90 |
0 |
0 |
|||||||
|
Cazorla et al. 2017 |
16 |
Marcos |
Typic |
0-18 |
13 |
3 |
C-W/S |
6 |
925 |
N |
88 |
0 |
0 |
|||||||
|
Arrigo et al. 1993 |
N |
176 |
0 |
0 |
||||||||||||||||
|
Landriscini et al. 2020 |
17 |
Marcos |
Typic |
0-20 |
9 |
3 |
S-C |
6 |
925 |
Undefined |
Undefined |
Undefined |
Undefined |
|||||||
|
S-C-CC1 |
Undefined |
Undefined |
Undefined |
Undefined |
||||||||||||||||
|
S-C-CC2 |
Undefined |
Undefined |
Undefined |
Undefined |
||||||||||||||||
|
S-C-CC3 |
Undefined |
Undefined |
Undefined |
Undefined |
||||||||||||||||
|
S-C-CC4 |
Undefined |
Undefined |
Undefined |
Undefined |
||||||||||||||||
|
S-C-CC5 |
Undefined |
Undefined |
Undefined |
Undefined |
||||||||||||||||
|
Minoldo et al. 2008 |
18 |
Bordenave |
Entic |
0-20 |
31 |
4 |
W-W |
77.3 |
614 |
NP |
29 |
5 |
0 |
|||||||
|
W-CC |
NP |
29 |
5 |
0 |
||||||||||||||||
|
W-W-CC-CC |
NP |
29 |
5 |
0 |
||||||||||||||||
|
W-P |
NP |
29 |
5 |
0 |
||||||||||||||||
|
Duval et al. 2019 |
19 |
Bordenave |
Entic |
0-20 |
13 |
3 |
W-W |
77.3 |
614 |
NP |
64 |
16 |
0 |
|||||||
|
Miglierina et al. 2000 |
3 |
W-W |
NP |
64 |
16 |
0 |
||||||||||||||
|
Galantini et al. 2006 |
3 |
W-G |
NP |
32 |
8 |
0 |
||||||||||||||
|
Galantini et al. 2014 |
||||||||||||||||||||
|
Duval et al. 2010 |
||||||||||||||||||||
|
Landriscini et al. 2016 |
||||||||||||||||||||
|
Fabrizi et al. 1998 |
20 |
Balcarce |
Typic |
0-18 |
7 |
3 |
W-W |
41.1 |
887 |
N |
120 |
0 |
0 |
|||||||
|
W-W |
P |
0 |
22 |
0 |
||||||||||||||||
|
W-W |
NP |
120 |
22 |
0 |
||||||||||||||||
|
W-Su |
N |
60 |
0 |
0 |
||||||||||||||||
|
W-Su |
P |
0 |
11 |
0 |
||||||||||||||||
|
W-Su |
NP |
60 |
11 |
0 |
||||||||||||||||
|
Studdert, Echeverría 2000 |
21 |
Balcarce |
Typic Petrocalcic Paleudoll |
0-17 |
12 |
4 |
W-W-W |
887 |
N |
105 |
0 |
0 |
||||||||
|
Studdert et al. 2011 |
W-S-W |
41.1 |
N |
63 |
0 |
0 |
||||||||||||||
|
W-Su-W |
N |
63 |
0 |
0 |
||||||||||||||||
|
W-C-W |
N |
93 |
0 |
0 |
||||||||||||||||
|
S-W-W |
N |
73 |
0 |
0 |
||||||||||||||||
|
S-S-W |
N |
38 |
0 |
0 |
||||||||||||||||
|
S-Su-W |
N |
38 |
0 |
0 |
||||||||||||||||
|
S-C-W |
N |
38 |
0 |
0 |
||||||||||||||||
|
Su-W-W |
N |
73 |
0 |
0 |
||||||||||||||||
|
Su-S-T |
N |
73 |
0 |
0 |
||||||||||||||||
|
Su-Su-W |
N |
73 |
0 |
0 |
||||||||||||||||
|
Su-C-W |
N |
55 |
0 |
0 |
||||||||||||||||
|
C-W-W |
N |
93 |
0 |
0 |
||||||||||||||||
|
C-S-W |
N |
58 |
0 |
0 |
||||||||||||||||
|
C-Su-W |
N |
58 |
0 |
0 |
||||||||||||||||
|
C-C-W |
N |
60 |
0 |
0 |
||||||||||||||||
|
Nontiel et al. 2019 |
22 |
Balcarce |
Typic Petrocalcic Paleudoll |
0-20 |
14 |
3 |
W-P1 |
887 |
N |
26 |
0 |
0 |
||||||||
|
Studdert 2008 |
26 |
3 |
W-P2 |
41.1 |
N |
49 |
0 |
0 |
||||||||||||
|
Eiza et al. 2004 |
26 |
3 |
W-P3 |
N |
68 |
0 |
0 |
|||||||||||||
|
González et al. 2012 |
26 |
3 |
W-P4 |
N |
83 |
0 |
0 |
|||||||||||||
|
26 |
3 |
W-P5 |
N |
83 |
0 |
0 |
||||||||||||||
|
14 |
3 |
W-P6 |
N |
Undefined |
0 |
0 |
||||||||||||||
|
14 |
3 |
W-P7 |
N |
Undefined |
0 |
0 |
||||||||||||||
|
Fabrizzi et al. 2003 |
23 |
Balcarce |
Petrocalcic Paleudoll |
0-15 |
7 |
4 |
W-S-W-C-C-Su-C |
41.1 |
887 |
N |
120 |
0 |
0 |
|||||||
|
N |
120 |
0 |
0 |
|||||||||||||||||
|
Vidaurreta et al. 2012 |
24 |
Balcarce |
Typic Petrocalcic Paleudoll |
0-20 |
10 |
3 |
C-S-W/S-W/S-C-S-W/S-C-S-W/S |
41.1 |
887 |
P |
0 |
30 |
0 |
|||||||
|
P |
0 |
30 |
0 |
|||||||||||||||||
|
Studdert et al. 2015 |
25 |
Balcarce |
Typic Petrocalcic Paleudoll |
0-20 |
22 |
6 |
C-Su-W |
41.1 |
887 |
N |
127 |
0 |
0 |
|||||||
|
Dominguez et al. 2009 |
||||||||||||||||||||
|
Moreno et al. 2014 |
||||||||||||||||||||
|
Diovisalvi et al. 2008 |
||||||||||||||||||||
|
Diovisalvi et al. 2006 |
||||||||||||||||||||
|
Studdert et al. 2006 |
||||||||||||||||||||
|
Divito et al. 2011 |
26 |
Balcarce |
Typic Petrocalcic Paleudoll |
0-20 |
8 |
8 |
C-S-W/S |
41.1 |
887 |
N |
50 |
0 |
0 |
|||||||
|
N |
91 |
0 |
0 |
|||||||||||||||||
|
Wyngaard et al. 2012 |
27 |
Balcarce |
Typic |
0-20 |
8 |
3 |
C-S-W/S |
41.1 |
887 |
NP |
86 |
38 |
0 |
|||||||
|
Wyngaard et al. 2013 |
NS |
86 |
0 |
19 |
||||||||||||||||
|
PS |
0 |
38 |
19 |
|||||||||||||||||
|
NPS |
86 |
38 |
19 |
|||||||||||||||||
|
NPS+M |
86 |
38 |
19 |
|||||||||||||||||
|
NPS+M+L |
86 |
38 |
19 |
|||||||||||||||||
|
NP |
86 |
38 |
0 |
|||||||||||||||||
|
NS |
86 |
0 |
19 |
|||||||||||||||||
|
PS |
0 |
38 |
19 |
|||||||||||||||||
|
NPS |
86 |
38 |
19 |
|||||||||||||||||
|
NPS+M |
86 |
38 |
19 |
|||||||||||||||||
|
NPS+M+L |
86 |
38 |
19 |
|||||||||||||||||
|
C= corn, W= wheat, S= soybean, W/S= double crop in a year wheat and soybean, Su= sunflower, CC= cover crop, B= barley, B/S= double crop barley and soybean, P= pasture. G= grassland. |
||||||||||||||||||||
|
N= nitrogen, P= phosphorus, S= sulfur, M= micronutrients, L= lime |
||||||||||||||||||||
|
1= soil equivalent mass (t ha-1) |
||||||||||||||||||||
Information regarding soil type and texture and total rainfall at the experimental sites was reported in the articles or was taken from soil maps (GeoINTA, 2022) and from the Climate Research Unit (CRU) database (CRU, 2022). To avoid double counting of data when several published articles involved the same experiment, only data from the longest period were used. Data were mostly taken from tables but data acquisition software was used to access graphical information (Getdata Graph Digitizer 2.24) when necessary. Since the study focused on the effects of fertilization on SOC sequestration, SOC stocks rather than concentrations were compared under fertilized and unfertilized conditions. If papers reported SOC stock (t ha-1), such data were directly used for analysis. If carbon concentration and soil bulk density were available, SOC stock was calculated. When only SOC concentration was reported, bulk density was estimated as described by Post and Kwon (2000) from SOC concentration and using 1.64 g cm-3 as bulk density of the mineral soil fraction. A factor of 1.72 was used for converting organic matter into carbon (Nelson & Sommers, 1996) in some cases.
Average SOC stock for each treatment was extracted and 109 fertilized vs. unfertilized pairs of SOC stocks were calculated for comparisons (Tables 2, 3). Sampling depth was 0-20 cm in about 80% of the experiments. In the remaining trials, soil was sampled at a lower depth, but those data were still included in the meta-analysis. All data were considered to come from topsoil. The initial SOC level of the soil was also registered when available. In all cases, the number of replications was available but standard deviations could be extracted in only 25% of the cases. In these latter cases, the average standard deviation/mean ratio was 0.068. An imputation procedure was used to estimate standard deviation of the whole dataset assuming that standard deviations were equal to 6.8% of the means (Wiebe et al., 2006). In some experiments, the use of the same unfertilized control treatment against which several fertilized treatments were compared to generates non-independent data in a meta-analysis, thus increasing the probability of Type I Error (Lajeunesse, 2011). In experiments from which various data pairs were extracted, SOC stocks of the fertilized treatments were averaged to achieve independent data (Noble et al. 2017, Song et al. 2020). The number of replicates of the fertilization treatments that were averaged was the sum of the replicates of the individual treatments. In such scenario, 69 independent data pairs were used for analysis. Although in some experiments, nutrients rates were not accurately defined, 71 experiments included nitrogen, phosphorus and sulfur rates, so cumulative rates applied to the soil could be calculated. When graminaceous crops were included, the ratio between the number of wheat, corn or gramineous cover crops over the total number of crops included in the rotation was calculated.
Table 2: Main data extracted from 27 experiments with 109 fertilization treatments in the Pampas regions. Unweighted averages and ranges are shown.
Tabla 2: Principales datos extractados de 27 experimentos con 109 tratamientos de fertilización. Se muestran promedios no ponderados y rangos.
|
Variable |
N |
Unit |
Mean |
Minimum |
Maximum |
|
Duration |
33 1 |
(years) |
14.1 |
4 |
31 |
|
Depth |
27 |
(cm) |
18.8 |
10 |
20 |
|
Sand |
27 |
(%) |
30.9 |
1.9 |
77.3 |
|
Rainfall |
27 |
(mm) |
923 |
614 |
1110 |
|
Graminaceus crops |
68 2 |
(%) |
59 |
0 |
100 |
|
Initial carbon |
25 3 |
(t ha-1) |
62.6 |
30.5 |
92.7 |
|
Carbon in control |
68 4 |
(t ha-1) |
53.8 |
23.7 |
77.8 |
|
Carbon loss in control (SOC Initial – SOC control) |
47 |
(t ha-1) |
6.20 |
-12.2 5 |
17.7 |
|
Annual carbon loss in control |
47 |
(t ha-1 yr-1) |
0.45 |
-2.03 5 |
1.44 |
|
Carbon in fertilized treatment |
109 |
(t ha-1) |
54.1 |
22.8 |
79.9 |
|
Carbon loss in fertilized treatment (SOC Initial – SOC fertilized) |
81 |
(t ha-1) |
4.00 |
-16.5 5 |
27.4 |
|
Annual carbon loss in fertilized treatment |
81 |
(t ha-1 yr-1) |
0.38 |
-2.23 5 |
3.43 |
|
Carbon gain in fertilized treatment (SOC fertilized – SOC control) |
109 |
(t ha-1) |
1.47 |
-15.4 |
11.6 |
|
Annual carbon gain in fertilized treatment |
109 |
(t ha-1 yr-1) |
0.12 |
-1.93 |
0.89 |
1 In one experiment, fertilization treatments started at different times.
2 Sixty eight different rotations were tested in 27 experiments.
3 In some experiments initial carbon content data were not available.
4 In some experiments various control treatments were used.
5 Negative data indicate carbon gain.
Table 3: Summary of fertilization treatments tested in 27 field experiments and the corresponding unweighted mean difference (SOC fertilized – SOC control).
Tabla 3: Resumen de los tratamientos de fertilización testeados en 27 experimentos y sus correspondientes diferencias medias no ponderadas (COS fertilizado – COS control).
|
Treatments |
n |
Mean N-P-S rates |
Unweighted mean |
|
|
|
(kg ha-1) |
(t C ha-1) |
|
All (defined and undefined rates) |
109 |
1.47 |
|
|
Defined rates |
71 |
0.97 |
|
|
Only N |
34 |
85-0-0 |
1.73 |
|
Only P |
6 |
0-26-0 |
-0.64 |
|
Only S |
3 |
0-0-24 |
1.90 |
|
NP |
11 |
57-15-0 |
1.20 |
|
NS |
2 |
86-19-0 |
2.90 |
|
PS |
8 |
0-36-21 |
0.63 |
|
NPS |
7 |
79-36-20 |
2.30 |
Meta-analysis
Meta-analytic methods were used to analyze the data. A detailed description of models and equations used can be found elsewhere (Alvarez, 2021). Two different weighting functions were applied: the inverse of the pooled variance (Rosenberg et al. 2000) and the sample size (Adams et al., 1997). The response ratio (RR) was chosen as effect size (ratio of SOC in fertilized treatment/SOC unfertilized control) which was log-transformed to approach the normal distribution before statistical analysis (Hedges et al., 1999). A bias-corrected for skewness 95% confidence interval was estimated by bootstrapping methods (Adams et al., 1997). Results were presented as percent change ((RR-1)*100). When the confidence interval did not overlap with 0 (zero), significant effects (P<0.05) of the fertilizer treatment on SOC stock in relation to the control were recognized (Rosenberg et al., 2000). Average RR and confidence intervals were calculated using a random effect model (Rosenberg et al. 2000) assuming that effect sizes were not fixed across all studies (Gurevitch & Hedges, 1999). The software used was MetaWin 2.0 (Rosenberg et al., 2000). For comparative purposes, the mean difference (SOC fertilized – SOC control) was also calculated. Pearson’s correlation analysis was used to study the effects of environmental variables on RR. No heterogeneity analysis to differentiate the effects of individual nutrients or rates on SOC could be conducted, since sample size in each category was insufficient (Kallenbach & Grandy 2011).
Carbon footprint of fertilizers
Carbon footprint due to the manufacture, transport and use of fertilizers has not been determined in Argentina. For this reason, literature values were used. Carbon footprint depends on the energy efficiency of the production process, the energy source used and the distance that the fertilizer is transported (Zhang et al., 2013). Average values were calculated as estimates for the Pampas, considering existing differences among regions (Table 4). When the difference between increments in SOC stock due to fertilization and the cumulative carbon footprint of fertilizers was negative, it was considered as a net flow of greenhouse gases to the atmosphere.
Table 4: Carbon footprint coefficients of fertilizer nutrients. In the cited literature carbon footprint is expressed as CO2 emission and its carbon equivalence (Ceq.) was calculated.
Tabla 4: Huella de carbono de los fertilizantes. Se calculó la equivalencia en carbono (Ceq.) de la huella de carbono presentada en la literatura como CO2.
|
Nutrient |
Reference |
Region |
Carbon footprints coefficient |
|
|
CO2 eq. (t t-1 nutrient) |
Ceq. |
|||
|
Nitrogen |
Chojnacka et al. (2019) |
Europe |
9.3 |
2.51 |
|
Zhang et al. (2013) |
Europe |
9.7 |
2.62 |
|
|
Zhang et al. (2013) |
China |
13.5 |
3.65 |
|
|
Brentrup et al. (2016) |
IPCC methodology |
10.4 |
2.81 |
|
|
Mean |
10.7 |
2.89 |
||
|
Phosphorus |
Ledgard & Falconer (2019) |
New Zealand |
1.90 |
0.51 |
|
Wood & Cowie (2004) |
Europe |
1.23 |
0.33 |
|
|
West & Marland, (2002) |
USA |
1.44 |
0.39 |
|
|
Mean |
1.52 |
0.41 |
||
|
Sulfur |
European Commission 2009 |
Europe |
0.063 |
0.017 |
RESULTS
Soil organic carbon measurements were performed in the topsoil, usually for the 0-20 cm in most experiments (Table 1). The average duration of the experiments was 14.1 years. In such period, most soils from unfertilized control and fertilized treatments lost SOC stock (Figure 2). Nonetheless, in three experiments where SOC initial values were low, SOC stocks increased, both in unfertilized and fertilized treatments. The mean loss of SOC stock was 6.2 t ha-1 and 4.0 t ha-1 for unfertilized control and fertilized treatments, respectively (Table 2). The average annual loss of SOC stock across the experiments varied between 0.45 and 0.38 t ha-1 yr-1 depending on whether it was the control or fertilized treatment.
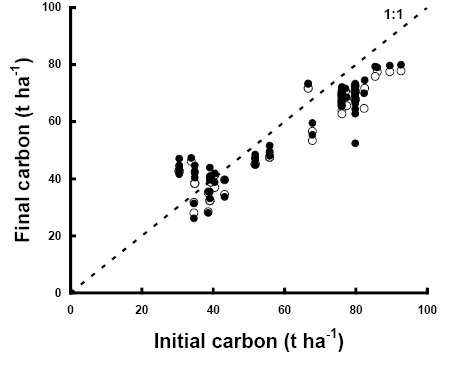
Figure 2: Relationship between initial and final SOC stocks of field experiments. Empty drops = unfertilized controls, full drops = fertilized treatments. Values below the 1:1 line indicate carbon loss. Values above the 1:1 line indicate carbon gain.
Figura 2: Relación entre el stock de COS al inicio y al final de los experimentos. Puntos vacíos= controles no fertilizados, puntos llenos= tratamientos fertilizados. Valores menores que la línea 1:1 indican pérdida de carbono y valores mayores indican ganancia de carbono.
Most nutrient combinations produced increases in SOC stock compared to unfertilized control treatments (Table 3). The meta-analysis indicated a significant SOC stock increase resulting from fertilization (Figure 3). An increase of about 3% of the SOC stock in the topsoil was reached, considering either the entire dataset or the independent dataset. A similar result was attained when weighting by variability or sample size. It was not possible to isolate controlling factors of the increase in SOC stock due to fertilization. The RR did not correlate with any of the following variables: duration of the experiment, soil texture, initial SOC content, rainfall at the experimental site, crop rotation or cumulative nitrogen rate (Figure 4).
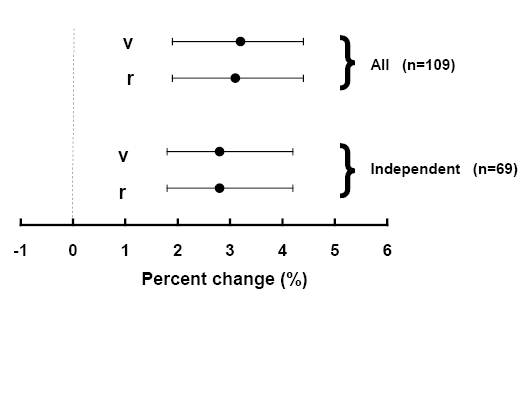
Figure 3: Percent change of soil organic carbon stock in fertilized treatments as compared with unfertilized controls from the meta-analysis. v = weighted by variability; r = weighted by sample size. Analyses are shown for the entire dataset (All) and for the independent dataset (Independent).
Figura 3: Resultados del meta-análisis. Porcentaje de cambio del stock de COS en los tratamientos fertilizados relativos al control. v = ponderado por variabilidad; r = ponderado por tamaño de muestra. Se presentan dos análisis, uno para el set completo de datos (All) y otro solo para los datos independientes (Independent).
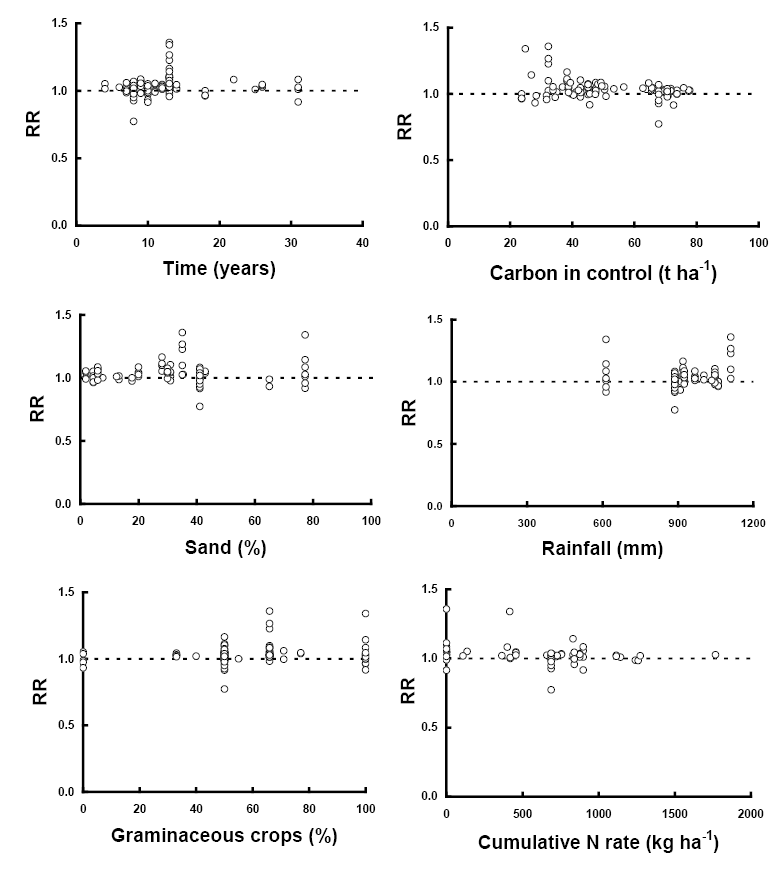
Figure 4: Correlation analysis between response ratio (RR) and management and environmental variables for 27 field experiments. No significant functions could be fitted.
Figura 4: Análisis de correlación entre la relación de respuesta (RR) y algunas variables ambientales y de manejo en 27 experimentos. No se pudo ajustar ninguna función significativa.
For 37% of the extracted fertilization treatments, the rates of the applied nutrients were not adequately defined. In some of these experiments the methods chosen to define the fertilizer rates were based on nutrient balances which usually leads to the application of high rates of nutrients, although they were not reported. The average rate of nitrogen was 3 to 4 times higher than the rates of phosphorus and sulfur (Table 5). The overall carbon footprint was much larger for nitrogen than for the other nutrients, due to both higher applied rates and larger greenhouse gas emissions of this nutrient (Table 5). Considering only those studies (71) in which the rates of all the applied nutrients could be calculated, the mean cumulative carbon footprint due to nitrogen, phosphorus and sulfur application was 2.31 t Ceq ha-1, nitrogen being responsible for approximately 98% of the emissions during the whole period of the experiments (Table 5).
Table 5: Cumulative carbon footprint of fertilization experiments in the Pampas.
Tabla 5: Huella de carbono acumulada en los experimentos pampeanos.
|
Nutrient |
n |
Mean rate |
Carbon footprints coefficient |
Cumulative rate |
Cumulative carbon |
|
|
|
(kg nutrient ha-1 yr-1) |
(t Ceq. t-1 nutrient) |
(t nutrient ha-1) |
(Ceq. t ha-1) |
|
Nitrogen |
54 |
78.5 |
2.89 |
1.03 |
2.98 |
|
Phosphorus |
32 |
26.8 |
0.41 |
0.27 |
0.11 |
|
Sulfur |
20 |
21.0 |
0.017 |
0.19 |
0.0032 |
For the 71 treatments with defined nutrient rates it was possible to compare the cumulative SOC stock increase with the cumulative carbon footprint of fertilization. The fertilizer carbon footprint more than doubled SOC removal by fertilization (Figure 5). As a consequence, there was a net flux of greenhouse gases into the atmosphere by fertilization treatments.
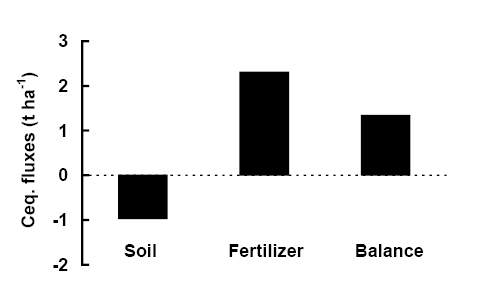
Figure 5: Greenhouse gas fluxes related to fertilizer application to and from the atmosphere (calculated as carbon equivalent (Ceq.) units). Negative fluxes indicate SOC increases in fertilized treatments related to control. Positive fluxes are emission of Ceq. to the atmosphere due to fertilizer use. Balance is the difference between both previous fluxes.
Figura 5: Flujos de gases de efecto invernadero desde y hacia la atmósfera producidos por la fertilización (calculados como equivalentes de carbono, Ceq.). Los flujos negativos indican incrementos del COS en los tratamientos fertilizados en relación al control. Flujos positivos representan emisiones de Ceq. hacia la atmósfera debido al uso de fertilizantes. El balance es la diferencia entre ambos flujos.
DISCUSSION
Based on published results from literature, this meta-analysis allowed determining that fertilization increases SOC stocks of the Pampas soils. Most global studies found considerable increases in SOC content in the upper soil layer due to fertilization, varying between 6% (Huang et al., 2020) and 15-16% (Geisseler & Scow, 2014; Han et al., 2016). Increments observed in the current study, however, were generally small (averaging 3%) and were not related to site or management factors, in agreement with findings from a prior global meta-analysis about the effects of nitrogen on cultivated soils (Lu et al., 2011).
The average carbon sequestration rate in fertilized soils in relation to unfertilized controls was 0.12 t ha-1 yr-1 with a total increase of 1.47 t C ha-1 in the Pampas soils. This represents an annual increase of 2.2‰ of the SOC stock due to fertilization. The results of a large number of experiments in China show an average sequestration rate of ca. 0.15 t C ha-1yr-1 (Waqas et al., 2020) with balanced fertilization. The total increase in SOC stock ranged from 1 t C ha-1 in initially rich SOC soils to 6 t C ha-1 in initially poor SOC soils (Ren et al., 2021). The effect of fertilization on SOC content in the Pampas is generally lower than that observed in most synthesis studies mentioned above. The slight effect of fertilization on SOC stock in the Pampas Region seems to be related to the low rate of nutrients applied. When SOC stocks were calculated for different data sets, i.e. treatments that received either low (< 50 kg N ha-1 year-1; n = 11) or high N rates (> 50 kg N ha-1 year-1; n = 30), SOC increases of 1.01 and 1.99 t SOC ha-1 were identified, respectively. As suggested, SOC changes respond to the amount of nitrogen applied.
At a global scale, it has been estimated that nitrogen addition generates an increase in plant biomass (Xu et al., 2020) and residue input to soils ranging between 5 % (Xu et al., 2020) and 30-35 % (Lu et al., 2011; Huang et al., 2020). The enhanced residue input through fertilization rules the increase in SOC stocks, especially under reduced soil fertility (Huang et al., 2020). In China’s croplands, yield increases of the main crops due to fertilization vary between 50% and 300% depending on the species (Waqas et al., 2020), which represents a huge difference in residue carbon inputs for fertilized or unfertilized soils. In the experiments across the Pampas Region included in this meta-analysis, the effect of fertilization on carbon input from crop residues was much less important. Carbon inputs from crop residues were evaluated in 13 of the experiments. Mean carbon inputs were only 12% higher in fertilized soils than in unfertilized controls (data not shown), which may account for the slight impact of fertilization on SOC stocks. Nevertheless, regular nutrient rates used by farmers of the Pampas are approximately half the rate applied in the experiments included in this meta-analysis (Alvarez et al., 2021). Therefore, the effect of fertilization on SOC stock under common agricultural management conditions is expected to be even lower than that estimated in this study.
Existing literature is contradictory as to what factors regulate the impact of fertilization on SOC stocks. It has been reported that temperature has positive (Ren et al., 2021), negative (Lu et al., 2011) or null (Han et al., 2016) effects on changes in SOC stocks produced by the application of nutrients. The impact of texture on SOC change is unclear (Waqas et al., 2020). Precipitation can have a positive impact (Ren et al., 2021) while the initial SOC level has a negative one (Ren et al., 2021). However, none of these possible effects have been observed in the Pampas experiments. The slight increase in SOC stocks of the Pampas soils cannot be attributed to a SOC level close to saturation. A regional analysis has shown that agricultural soils of the Pampas are far from saturation and they could double their SOC content in the topsoil (Alvarez & Berhongaray, 2021). Although fertilization led to increases in SOC stocks when comparing fertilized to unfertilized treatments, overall SOC stocks declined in most experiments compared to initial levels. The decrease of SOC stocks during the experiments was 4-6 t ha-1, a larger amount than the gain produced by fertilization. Fertilization did not compensate for SOC losses due to cultivation in most cases.
Unfortunately, the impact of fertilization on the subsurface soil was not evaluated in any of compiled experiments. Since SOC has not been affected below 50 cm depth for over a century of cultivation in the Pampas (Berhongaray et al., 2013), it can be assumed that below that depth there will be no impact of fertilization on soil carbon pools. Under the most optimistic scenario, a similar relative increase in SOC can be assumed to occur in topsoil and subsoil. The average topsoil SOC stock for the 71 treatments in which nutrient rates were accurately defined was 57.5 t ha-1 and the average RR was 1.02. By applying a SOC stratification model (Berhongaray et al., 2013) for Pampas soils, the SOC stock for the 0-50 cm was estimated to be 96.1 t ha-1. The potential carbon sequestration resulting from fertilization for the 0-50 cm soil layer would increase to 1.9 t ha-1, but it would still be lower than the cumulative carbon footprint (2.31 t Ceq ha-1). Consequently, fertilization does not contribute to mitigation of climate change in the region.
Studies on carbon footprint in agriculture do not normally consider changes in soil carbon due to the difficulty of estimating them. For example, in the Pampas Region the carbon footprint of corn production has been calculated at 1.4 t CO2 eq. ha-1 yr-1 (0.38 t Ceq. ha-1 yr-1) in the Province of Córdoba, of which 40% results from the use of nitrogen fertilizers (Bongiovani et al. 2023). If the carbon sequestration coefficients in the soil by fertilization estimated in the present study were used, the carbon footprint of corn production would be reduced by 30%. This indicates the importance of having data on the effect of management practices such as fertilization on SOC stock. However, site-specific coefficients should be available. In the case of those calculated in this study, most of the experiments were carried out in humid areas and extrapolating the averages to semi-arid areas is dangerous.
CONCLUSIONS
In the Pampas, small increases in SOC stocks are achieved through fertilization when comparing fertilized versus unfertilized soils. However, most soils in the experiments studied lost SOC over time and such loss was not compensated by the application of nutrients. At the same time, the greenhouse gases emitted due to the manufacture, transport and application of fertilizers will generate a warming effect that will not be compensated by carbon sequestration in the soil due to fertilization. Nutrient application should be considered as a practice with no potential to mitigate global warming in the region.
ACKNOWLEDGEMENT
This study was granted by the University of Buenos Aires (UBACYT 20020170100016BA).
REFERENCES
Adams, D.C., Gurevitch, J., Rosenberg, M.S. (1997). Resampling tests for meta-analysis of ecological data. Ecology 78, 1277-1283.
https://doi.org/10.1890/0012-9658(1997)078[1277:RTFMAO]2.0.CO;2
Alvarez, C., Steinbach, H.S., & Alvarez, R. (2021). El rol de los fertilizantes en la agricultura. In: Fertilidad de Suelos y Fertilización en la Región Pampeana. R. Alvarez editor. Chapter 10. Editorial de la Facultad de Agronomía-Universidad de Buenos Aires.
Alvarez, R. (2005). A review of nitrogen fertilizer and conservation tillage effects on soil organic carbon storage. Soil Use and Management 21, 38-52. https://doi:10.1111/j.1475-2743.2005.tb00105.x
Alvarez, R. (2021). Comparing productivity of organic and conventional farming systems: a quantitative review. https://doi.org/10.1080/03650340.2021.1946040
Alvarez, R., & Berhongaray, G. (2021). Soil organic carbon sequestration potential of Pampean soils: comparing methods and estimation for surface and deep layers. Soil Research https://doi.org/10.1071/SR20257
Arrigo, N.M., Palma, R.M., Conti, M.E., & Constantini, A.O. (1993). Cropping rotations: effect on aggregate stability and biological activity. Communication in Soil Science and Plant Analysis 24, 2441-2453. https://doi.org/10.1016/j.still.2018.08.006
Basak, N., Mandal, B., Datta, A., Kundu, M., Rai, A.K., Basak, P., & Miltran, T. (2021). Stock and stability of organic carbon in soils under major agro-ecological zones and cropping systems of sub-tropical India. Agriculture Ecosystems and Environment 312, 107317. https://doi.org/10.1016/j.agee.2021.107317
Beltrán, M.J., Sainz-Rozas, H., Galantini, J.A., Romaniuk, R.I., & Barbieri, P. (2018). Cover crops in the Southeastern región of Buenos Aires, Argentina: effects on organic matter physical fractions and nutrient availability. Environmental Earth Sciences 77, 428-438. https://doi.org/10.1007/s12665-018-7606-0
Berhongaray, G., Alvarez, R., De Paepe, J.L., Caride, C., & Cantet, R. (2013). Land use effects on soil carbon in the Argentine Pampas. Geoderma 192, 97-110. https://doi.org/10.1016/j.geoderma.2012.07.016
Bongiovani, R., Tuninetti, L., Espósito, G., Fiant, S., Ponieman, K., Alvarez, S., Chiappero, N., & Oliverio, N. (2023). Carbon footprint of corn as a link between production and the environment (in Spanish). Ciencia del Suelo (https://cienciadelsuelo.suelos.org.ar/wp-content/uploads/2023/08/775-Texto-del-artiIculo-5737-1-11-20230805.pdf).
Brentup, F., Hoxha, A., & Christensen, B. (2016). Carbon footprint analysis of mineral fertilizer production in Europe and other world regions. Conference: The 10th International Conference on life Cycle Assestment of Food (LCA Food 2016), Dublin, Ireland.
Cazorla, C.R., Cisneros, J., Moreno, I.S., & Galarza, C.M. (2017). Mejora en el carbono del suelo y estabilidad de agregados por fertilización y cultivos de cobertura. Ciencia del Suelo 35, 301-313.
Chojnacka, K., Kowalski, Z., Kulcycka, J., Dmytryk, A., Gorecki, H., Ligas, B., & Gramza, M. (2019). Carbon footprint of fertilizer technologies. Journal of Environmental Management 231, 962-967. https://doi.org/10.1016/j.jenvman.2018.09.108
Ciampitti, I.A., García, F.O., Picone, L.I., & Rubio, G. (2011). Soil Carbon and phosphorus pools in Field Crop Rotations in Pampean Soils of Argentina. Soil Science Society of America Journal 75, 1-10. https://doi:10.2136/sssaj2010.0168
Climate Research Unit (CRU). (2022). High-resolution gridded datasets. Available at https://crudata.uea.ac.uk/cru/data/hrg/
Crespo, C., Wyngaard, N., Sainz Rozas, H., Barbagelata, P., Barraco, M., Gudelj, V., & Barbieri, P. (2021). Improving soil organic nitrogen and sulfur pools by cover cropping and crop fertilization in soybean-based cropping systems. Soil and Tillage Research 213,105138. https://doi.org/10.1016/j.still.2021.105138
Crespo, C., Wyngaard, N., Sainz Rozas, H., Studdert, G.A., Barraco, M., Gudelj, V., Barbagelata, P., & Barbieri, P. (2021). Effect of intensified cropping sequences on soil physical properties in contrasting environments. Catena 207, 105690. https://doi.org/10.1016/j.catena.2021.105690
Diovisalvi, N.V., Studdert, G.A., Dominguez, G.D., & Eiza, M.J. (2006). Materia orgánica total y particulada en un molisol de Balcarse bajo dos Sistema de labranza. Proceedings XX Congreso Argentina de la Ciencia del Suelo.
Diovisalvi, N.V., Studdert, G.A., Domínguez, G.F., & Eiza, M.J. (2008). Fracciones de carbono y nitrógeno orgánicos y nitrógeno anaeróbico bajo agricultura continua con dos sistema de labranza. Ciencia del Suelo 26, 1-11.
Divito, G.A., Sainz Rozas, H.R., Echeverría, H.E., Studdert, G.A., & Wyngaard, N. (2011). Long term nitrogen fertilization: soil property changes in an Argentinean Pampas soil under no tillage. Soil and Tillage Research 114, 117-126. https://doi.org/10.1016/j.still.2011.04.005
Dominguez, J., & Rubio, G. (2019). Agriculture. In: The soils of Argentina. G. Rubio, R.S. Lavado, F.X. Pereyra (Editors). Springer, Cham, Switzerland
Domínguez, G.F., Diovisalvi, N.V., Studdert, G.A., & Monterubbianesi, M.G. (2009). Soil organic C and N fractions under continuous cropping with contrasting tillage systems on Mollisols of the southeastern Pampas. Soil and Tillage Research 102, 93-100. https://doi.org/10.1016/j.still.2008.07.020
Duval, M.E., Iglesias, J.O., Galantino, J.A., Martinez, J.M., Krüger, H., & Venanzi, S. (2010) Sistemas de producción con trigo en la región semiárida bonaerense: efectos de largo plazo sobre el carbono y nitrógeno edáfico. Proceedings XXII Congreso Argentino de la Ciencia del Suelo.
Duval, M.E., Martinez, J.M., & Galantini, J.A. (2019). Assessing soil quality index based on soil organic carbon fractions in different long-term wheat systems under semiarid conditions. Soil Use and Management 36, 71-82. https://doi.org/10.1111/sum.12532
Eiza, M.J., Fioriti, N., Studdert, G.A., & Echeverría, H. E. (2004). Fracciones de carbono orgánico en la capa arable: efecto de los sistemas de cultivo y de la fertilización nitrogenada. Proceedings XIX Congreso Argentino de la Ciencia del Suelo.
European Commission (2009) Methodology for the free allocation of emission allowances in the EU ETS post 2012. Sector report for the gypsum industry. https://ec.europa.eu/clima/system/files/2016-11/bm_study-lime_en.pdf
Fabrizi, K.P., Morón, A., & García, F.O. (2003). Soil Carbon and Nitrogen Organic Fractions in Degraded vs Non-Degraded Mollisols in Argentina. Soil Science Society of America Journal 67, 1831-1841. https://doi.org/10.2136/sssaj2003.1831
Fabrizzi, K., Picone, L., Berardo, A., & Garcia, F. (1998). Efecto de la fertilización nitrogenada y fosfatada en las propiedades químicas de una argiudol típico. Ciencia de Suelo 16, 71-76.
Fageria, N.K. (2012). Role of soil organic matter in maintaining sustainability of cropping systems. Communications in Soil Science and Plant Analysis 43, 2063-2113. https://doi.org/10.1080/00103624.2012.697234
Feller, C., Blanchart, E., Bernoux, M., Lal, R., & Manlay, R. (2012). Soil fertility concepts over the past two centuries: the importance attributed to soil organic matter in developed and developing countries. Archives of Agronomy and Soil Science ٥٨, S٣-S٢١. https://doi.org/10.1080/03650340.2012.693598
Galantini, J., & Rosell, R. (2006). Long-term fertilization effects on soil organic matter quality and dynamics under different production systems in semiarid Pampean soils. Soil and Tillage Research 87, 72-79. https://doi.org/10.1016/j.still.2005.02.032
Galantini, J.A., Duval, M.E., Iglesias, J.O., & Krüger, H. (2014). Continuous wheat in wemiarid regions. Long-term effects on stock and quality of soil organic carbon. Soil Science 179, 284-292. https://doi: 10.1097/SS.0000000000000072
Garcia, F., Boxler, M., Minteguiaga, J., Pozzi, R., Firpo, L., Ciampiti, I., Correndo, A., Bauschen, F., Berardo, A., & Reussi Calvo, N. (2010). La red de nutrición de la Región CREA Sur de Santa Fe Resultados y conclusiones de los primeros diez años 2000-2009. Red CREA. ISBN 978-987-1513-07-09.
Geisseler, D., & Scow, K.M. (2014). Long-term effects of mineral fertilizers on soil microorganisms- A review. Soil Biology and Biochemistry 75, 54-63. https://doi.org/10.1016/j.soilbio.2014.03.023
GeoINTA (2022) www.geointa.inta.gob.ar
González, M.S., Picone, L.I., Videla, C.C., Wyngaard, N., & Domínguez, G. (2012) Cambios en el carbono nitrógeno y fósforo de la materia orgánica particulada inducidos por labranzas contrastantes. Proceedings XXIII Congreso Argentino de la Ciencia del Suelo.
Gross, A., & Glaser, B. (2021). Meta-analysis on how manure application changes soil organic carbon storage. Scientific Reports 11, 5516. https://doi.org/10.1038/s41598-021-82739-7
Gurevitch, J., & Hedges, L.V. (2001). Meta-analysis. Combining the results of independent experiments. In: Design and analysis of ecological experiments, S.M. Scheiner and J. Gurevitch (Eds.). Oxford University Press.
Han, D., Wiesmeier, M., Conant, R.T., Kühnel, A., Sun, Z., Kögel-Knaber, I., Hou, R., Cong, P., Liang, R., & Ouyang, Z. (2018). Large soil organic carbon increase due to improved agronomic management in the North china Plain from 1980s to 2010s. Global Change Biology 24, 987-1000. https://doi: 10.1111/gcb.13898
Han, P., Zhang, W., Wang, G., Sun, W., & Huang, Y. (2016). Changes in soil organic carbon in croplands subjected to fertilizer management: a global meta-analysis. Scientific Reports 6, 27199. https://doi.org/10.1038/srep27199
Hedges, L.V., Gurevitch, J., & Curtis, P.S. (1999). The meta-analysis of response ratios in experimental ecology. Ecology 80, 1150-1156. https://doi.org/10.1890/0012-9658(1999)080[1150:TMAORR]2.0.CO;2
Huang, X., Terrer, C., Feike, J., Dijkstra, A.,Hungate, B.A., Zhang, W., & Van Groenigen, J. (2020). New soil carbon sequestration with nitrogen enrichment: a meta-analysis. Plant and Soil 454, 299–310. https://doi.org/10.1007/s11104-020-04617-x
INDEC. (2022). Censos Agropecuarios 2002, 2008 and 2018. Available at: https://www.indec.gob.ar/indec/web/Nivel4-Tema-3-8-87
Irizar, A., Andriulo, A., Sasal, C., Restovich, S., Darder, L., Rimatori, F., & Hanuch, L. (2006). Efecto de diferentes sistemas de labranzas y de la fertilización nitrogenada sobre el carbono orgánico partículado en la rotación maíz-trigo/soja. Proceedings XX Congreso Argentino de la Ciencia del Suelo.
Jian, J., Du, X., Reiter, M., & Stewart, R.D. (2020). A meta-analysis of global cropland soil carbon changes due to cover cropping. Soil Biology and Biochemistry 143, 107735. https://doi: 10.1016/j.soilbio.2020.107735
Kallenbach C, & Grandy AS (2011) Controls over soil microbial biomass responses to carbon amendments in agricultural systems: a meta-analysis. Agriculture Ecosystems and Environment 144, 241-252. https://doi: 10.1016/j.agee.2011.08.020
Ladha, J.K., Reddy, C.K., Padre, A.T., & van Kessel. C. (2011). Role of nitrogen fertilization in sustaining organic matter in cultivated soils. Journal of Environmental Quality 40, 1756-1766. https://doi: 10.2134/jeq.2011.0064
Lajeunesse, M.J. (2013). Recovering missing or partial data from studies: a survey of conversions and imputations for meta-analysis. In: J Koricheva, J Gurevich, and K Mengersen, editors. Handbook of meta-analysis in ecology and evolution. Princeton University Press, Princeton, New Jersey, USA.
Lal, R. (2017). Digging deeper: a holistic perspective of factors affecting soil organic carbon sequestration in agroecosystems. Global Change Biology 24, 3285-3301. https://doi.org/10.1111/gcb.14054
Landriscini, M.R., Duval, M.E., Galantini, J.A., Iglesias, J.O., & Cazorla, C.R. (2020). Changes in soil organic carbon fractions in a sequence with cover crops. Spanish Journal of Soil Science 10, 137-153.
Landriscini, M.R., Galantini, J.A., & Duval, M.E. (2016). Variación de las fracciones orgánicas resistentes en suelos de la Región Pampeana. Proceedings XXV Congreso Argentino de la Ciencia del Suelo.
Ledgard, S., & Falconer, S. (2019). Update of the carbon footprint of fertilizer used in New Zealand. Report for Fertiliser Association of New Zealand. RE450/2019/059.
Liu, C., Lu, M., Bo, J.C., & Fang, C. (2014). Effects of Straw carbon input on carbon dynamics in agricultural soils: a meta-analysis. Global Change Biology 20,1366-1381. https://doi.org/10.1111/gcb.12517
Lu, M., Zhou, X., Luo, Y., Yang, Y., Fang, C., Chen, J., & Li, B. (2011). Minor stimulation of soil carbon storage by nitrogen addition: a meta-analysis. Agriculture Ecosystems and Environment 140, 234-244. https://doi.org/10.1016/j.agee.2010.12.010
Manso, L., & Forján, H. (2014). Contenido de Carbono orgánico luego de 15 años de agricultura con diferentes labranzas. Proceedings XXIV Congreso Argentino de la Ciencia del Suelo.
Martinez, J.P., Barbieri, P.A., Cordone, G., Sainz Rozas, H.R., Echeverria, H.A., & Studdert, G.A. (2014). Secuencias con predominio de soja y su efecto sobre el carbono orgánico. Proceedings XXIV Congreso Argentino de la Ciencia del Suelo.
Martínez, J.P., Barbieri, P.A., Cordone, G., Sainz Rozas, H.R., Echeverría, H.A., & Studdert, G.A. (2014). Nitrógeno orgánico y NAN en secuencias con predominio de Soja. Proceedings XXIV Congreso Argentino de la Ciencia del Suelo.
Martinez, J.P., Crespo, C., Sainz Rosas, H., Echeverría, H., Studdert, G., Martinez, F., Cordone, G., & Barbieri, P. (2019). Soil Organic carbon in cropping sequences with predominance of soybean in the Argentinean humid Pampas. Soil Use and Management 36, 173-183. https://doi.org/10.1111/sum.12547
Melchiori, R.J.M., Novelli, L.E., Gregorutti, V.C., & Caviglio, P. (2014). Stover and Soil Organic Carbon in Long-Term Nitrogen-Fertilizer Maize. Agronomy Journal 106:1709-1716. https://doi.org/10.2134/agronj14.0194
Miglierina, A.M., Iglesias, J.O., Landriscini, M.R., Galantini, J.A., & Rosell, R.A. (2000). The effects of crop rotation and fertilization on wheat productivity in the Pampean semiarid region of Argentina. 1. Soil physical and chemical properties. Soil and Tillage Research 53,129-135. https://doi.org/10.1016/S0167-1987(99)00096-3
MINAGRI. (2022). Ministerios de agricultura, ganadería y pesca-Argentina. Estimaciones agrícolas, series históricas. Available at: https://www.magyp.gob.ar/sitio/areas/estimaciones/ (Accessed 02/25/2022).
Minasny, B., Malone, B.P., McBratney, A.B., Angers, D.A., Arrouays, D., Chambers, A., Chaplot, V., Chen, Z.S., Cheng, K., Das, B.S., Field, D., Gimona, A., Hedley, C.A., Hong, S.Y., Mandal, B., Marchant, B.P., Martin, M., McConkey, B.G., Mulder, V.L., O’Rourke, S., Richer-de-Forges, A., Odeh, I., Padarian, J., Paustian, K., Pan, G., Poggio, L., Savin, I., Stolbovoy, V., Stockmann, U., Sulaeman, Y., Tsui, C.C., Vågen, T.G., van Wesemael, B., & Winowiecki, L. (2017). Soil carbon 4 per mille. Geoderma 292, 59–86. https://doi.org/10.1016/j.geoderma.2017.01.002
Minoldo, G.V., Galantini, J.A., Iglesias, J.O., Krüger, H., & Venanzi, S. (2008). Dinámica de las fracciones orgánicas de suelo bajo diferentes rotaciones en la región semiárida pampeana. Proceedings XXI Congreso Argentino de la Ciencia del Suelo.
Montiel, F.S., Moreno, R., Dominguez, G.F., & Studdert, G.A. (2019). Validación de Rothc para simular cambios en el carbono orgánico edáfico bajo rotaciones mixtas y siembra directa. Ciencia del Suelo 37, 281-297.
Moreno, R., Studdert, G.A., Monterubbianessi, M.G., & Irigoyen, A.I. (2014). Validación independiente del modelo de simulación AMG en Molisoles del Sudeste Bonaerense. Proceedings XXIV Congreso Argentino de la Ciencia del Suelo.
Nelson, D.W., & Sommers, L.E. (1996). Total carbon, organic carbon, and organic matter. In: Methods of soil analysis, Part 3: chemical methods. Ed. D.L. Sparks et al. SSSA Book Series 5, Madison, USA.
Noble, D.W.A., Lagisz, M., O´Dea, R.E., & Nakagawa, S. (2017). Non independence and sensitivity analysis in ecological and evolutionary meta-analysis. Molecular Ecology 26, 2410-2425. https://doi.org/10.1111/mec.14031.
Noceli Pac, S. (2018). Update. Evolution of no till adoption in Argentina (AAPRESID Ed.)
Paustian, K., Lehmann, J., Ogle, S., Reay, D., Robertson, G.P., & Smith, P. (2016). Climate-smart soils. Nature 532, 49-57. https://doi.org/10.1038/nature17174
Post, W.M., & Kwon, K.C. (2000). Soil carbon sequestration and land use change: processes and potential. Global Change Biology 6, 317-327.
Ramirez, K., Craine, J., & Fierer, N. (2012). Consistent effects of nitrogen amendments on soil microbial communities and processes across biomes. Global Change Biology. https://doi: 10.1111/j.1365-2486.2012.02639.x
Ren, F., Misselbrook, T.H., Sun, N., Zhang, X., Zhang, S., Jiao, J., Xu, M., & Wu, L. (2021). Spatial changes and driving variables of topsoil organic carbon stocks in Chinese cropland under different fertilization strategies. The Science of the Total Environmemt 767, 144350. https://doi.org/10.1016/j.scitotenv.2020.144350
Rosenberg, M.S., Adams, D.C., & Gurevitch, J. (2000). MetaWin. Statistical software for meta-analysis, version 2.0.
Schlesinger, W.H., & Amundson, R. (2018). Managing for soil carbon sequestration: Let’s get realistic. Global Change Boilogy 25, 386-389. https://doi.org/10.1111/gcb.14478
Song, C,, Peacor, S.D., Osenberg, C., & Bence, J.R. (2020). An assessment of statistical methods for nonindependent data in ecological meta-analysis. Ecology e03184. https://doi.org/10.1002/ecy.3490
Soussana, J.F., Lutfalla, S., Ehrhardt, F., Rosenstock, T., Lamanna, C., Havlik. P., Richards, M., Wollenberg, E., Chotte, J.L., Torquebiau, E., Ciais, P., & Lal, R. (2019). Matching policy and science: Rationale for the “4 per 1000-soils for food security and climate” initiative. Soil and Tillage Research 188, 3-15. https://doi.org/10.1016/j.still.2017.12.002
Studdert, G.A. 2008. Uso del ROTHC-C para simular cambios en la materia orgánica de un molisol del sudeste bonaerense bajo agricultura continua. Proceedings XXI Congreso de la Ciencia del Suelo.
Studdert, G.A., & Echeverría, H.E. (2000). Crop rotations and nitrogen fertilization to manage soil organic carbon dynamics. Soil Science Society of America Journal 64, 1496-1503. https://doi.org/10.2136/sssaj2000.6441496x
Studdert, G.A., Domínguez, G.F., & Diovisalvi, N.V. (2006). Variación de la material orgánica en un molisol de Balcarce bajo agricultura continua. Proceedings XX Congreso Argentina de la Ciencia del Suelo.
Studdert, G.A., Dominguez, G.F., Zagame, M.C., & Carabaca, J.C. (2015). Variación estacional de carbón orgánico partículado y nitrógeno anaeróbico. Ciencia del Suelo 33, 65-77.
Studdert, G.A., Monterubbianesi, M.G., & Dominguez, G.F. (2011). Use of RothC to stimulate changes of organic carbon stock in the arable layer of a Mollisol of the southeastern Pampas under continuous cropping. Soil and Tillage Research 117, 191-200.
Sykes, A.J., Macleod, M., Eory, V., Rees, R.M., Payen, F., Myrgiotis, V., Williams, M., Sohi, S., Hillier, J., Moran, D., Manning, D.A.C., Goglio, P., Seghetta, M., Williams, A., Harris, J., Dondini, M., Walton, J., House, J., & Smith, P. (2020). Characterizing the biophysical, economic and social impacts of soil carbon sequestration as a greenhouse gas removal technology. Global Change Biology 26, 1085–1108. https://doi. 10.1111/gcb.14844
Tian, K., Zhao, Y., Xu, X., Hai, N., Huang, B., & Dengd, W. (2015). Effects of long-term fertilization and residue management on soil organic carbon changes in paddy soils of China: A meta-analysis. Agriculture Ecosystems and Environment 204, 40-50. https://doi.org/10.1016/j.agee.2015.02.008
Vega Jara, L., Gutierrez Boem, F., Garcia, F., & Rubio, G. (2020). Long-term fertilization does not affect soil carbon/nitrogen/sulfur ratios or the propagation between labile and non labile fractions in Mollisols. Soil Science Society of America Journal 84, 798-810. https://doi.10.1002/saj2.20058
Verdenelli, R.A., Chavarría, D., Dominichin, M.F., Rovea, A., Vargas-Gil, S., & Meriles, J.M. (2018). Influence of 12-years of NPS fertilization on soil quality, microbial community and activity under conservation agricultural management. Ciencia del Suelo 36, 99-109
Vidaurreta, A., Wyngaard, N., Echeverría, H.E., & Picone, L.I. (2012). Carbono y Fósforo en la fracción particulada: efecto de la agricultura continua. Proceedings XIX Congreso Argentino de Ciencia del Suelo.
Vivas, H.S., Candioti, V., Albrecht, R., Martins, L., & Hotian, J.L. (2012). Fertilización P*S sobre los aportes de carbono edáfico en una rotación agrícola. Proceedings XIX Congreso Latinoamericano de la Ciencia del Suelo.
Waqas, M.A., Li, Y., Lal, R., Wang, X., Shi, S., Zhu, Y., Li, J., Xu, M., Wan, Y., Qin, X., Gao, Q., & Liu, S. (2020). When does nutrient management sequester more carbon in soils and produce high and stable grain yields in China? Land Degradation and Development 31, 1–16. https://doi.org/10.1002/ldr.3567
West, T.O., & Marland, G. (2002). A synthesis of carbon sequestration, carbon emissions, and net carbon flux in agriculture: comparing tillage practices in the United States. Agriculture Ecosystems and Environment 91, 217-232. https://doi.org/10.1016/S0167-8809(01)00233-X
Wiebe, N., Vandermeer, B., Platt, R.W., Klassen, T.P., Moher, D., & Barrowman, N.J. (2006) A systematic review identifies a lack of standardization in methods for handling missing variance data. Journal of Clinical Epidemiology 59, 342-353. https://doi.10.1016/j.jclinepi.2005.08.017
Wood, S., & Cowie, A. 2004. A review of greenhouse gas emission factors for Fertilizer production. http://large.stanford.edu/courses/2014/ph240/yuan2/docs/wood.pdf
Wyndgaard, N., Vidaurreta, A., Echeverría, H.E., & Picone, L.I. (2013). Dynamics of Phosphorus and Carbon in the Soil Particulate fraction under different management practices. Soil Science Society of America Journal 77,1584-1590. https://doi.org/10.2136/sssaj2013.04.0137
Wyngaard, N., Echeverría, H., Sainz-Rozas, H.R., & Divito, G.A. (2012). Fertilization and tillage effects on soil properties and maize yield in a Southern Pampas Argiudoll. Soil and Tillage Research 119, 22-30. https://doi.org/10.1016/j.still.2011.12.002
Xu, C., Xu, W., Ju, C., Chen, H.Y.H., Wilsey, B.J., Luo, Y., & Fan, W. (2020). Long-term, amplified responses of soil organic carbon to nitrogen addition worldwide. Global Change Biology 27, 1170-1180. https://doi.org/10.1111/gcb.15489
Xu, H., Sieverding, H., Kwon, H., Clay, D., Stewart, C., Johnson, J.M.F, Qin, Z., Karlen, D.L., & Wang, M. (2019). A global meta-analysis of soil organic carbon response to corn stover removal. GCB Bioenergy 11, 1215–1233. https://doi.org/10.1111/gcbb.12631
Xu, S., Sayer, E., Eisenhauer, N., Lu, X., Wang, J., & Liu, C. (2021). Aboveground litter inputs determine carbon storage across soil profiles: a meta-analysis. Plant and Soil 462, 429-444. https://doi.org/10.1007/s11104-021-04881-5
Zhang, W., Dou, Z., He. P., Ju, X., Powlson, D., Chadwick, D., Norse, D., Lu, Y., Zhang, Y., Wu L., Chen, X., Cassman, K.G., & Zhang, F. (2013). New technologies reduce greenhouse gas emissions from nitrogenous fertilizer in China. Proceeding of the National Academy of Sciences 110, 8375-8380. https://doi.org/10.1073/pnas.1210447110
Revista científica de la Asociación Argentina de la Ciencia del Suelo